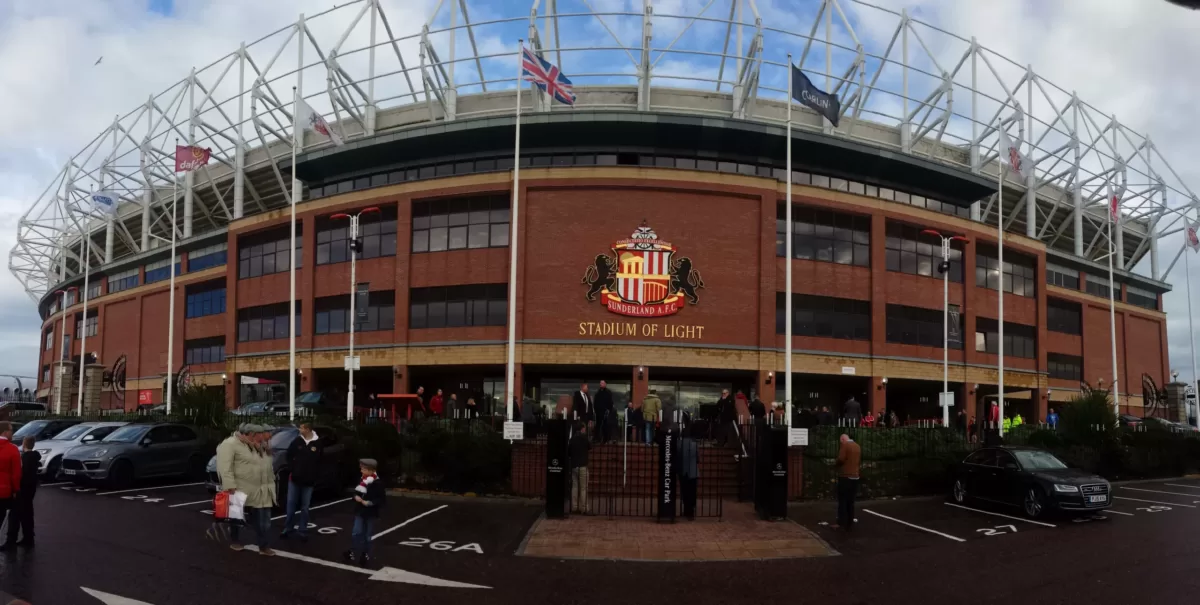
We’ve been criticised to ridiculous levels by national journalists who know nothing of what it’s like to attend the Stadium of Light and support Sunderland. In the table below, Peter Stamp puts us top of a table that shows just how bad we’ve had it. The league provides a ratio of attendance against points gained. The bigger the attendance and lower the points score, the higher you sit. There we are, perched at the top, masses of us turning up to witness defeat after defeat. Wonder if this might make a few of those journalists understand just why so many wandered off apathetically when Palace destroyed us in 15 minutes?
| Home Pts | Home Games | Avg Home Pts | Avg Home Att (X1K) | Ratio Att/Pts | |
| Sunderland | 16 | 17 | 0.941 | 43 | 45.69 |
| Aston Villa | 15 | 16 | 0.938 | 33 | 35.20 |
| Newcastle | 22 | 15 | 1.467 | 51 | 34.77 |
| Leicester | 14 | 14 | 1.000 | 32 | 32.00 |
| Man Utd | 43 | 17 | 2.529 | 75 | 29.65 |
| Everton | 22 | 15 | 1.467 | 38 | 25.91 |
| Arsenal | 36 | 15 | 2.400 | 60 | 25.00 |
| Liverpool | 32 | 17 | 1.882 | 45 | 23.91 |
| Hull | 16 | 15 | 1.067 | 23 | 21.56 |
| West Ham | 28 | 17 | 1.647 | 35 | 21.25 |
| Man City | 33 | 15 | 2.200 | 45 | 20.45 |
| West Brom | 21 | 17 | 1.235 | 25 | 20.24 |
| Crystal Palace | 18 | 15 | 1.200 | 24 | 20.00 |
| Burnley | 18 | 17 | 1.059 | 19 | 17.94 |
| Stoke | 23 | 15 | 1.533 | 27 | 17.61 |
| Chelsea | 39 | 15 | 2.600 | 42 | 16.15 |
| QPR | 19 | 17 | 1.118 | 18 | 16.11 |
| Tottenham | 38 | 17 | 2.235 | 36 | 16.11 |
| Southampton | 33 | 17 | 1.941 | 31 | 15.97 |
| Swansea | 29 | 17 | 1.706 | 21 | 12.31 |


